One number, three answers: KPI governance at Vallora Logística
KPI governance
KPIs
Management
R
Three departments, three absenteeism rates for the same month. How 40 KPIs became 14, each with a definition sheet, an owner and a change rule.
Fictional case. Vallora Logística S.A., its departments, people and KPIs do not exist. The three absenteeism rates were calculated from the fictional dataset of the Absenteeism Radar; the inventory, the definition sheets and the rules were written for this case. The method is real.
Download the three monthly rates (CSV) · Download the KPI inventory (CSV)
The CSV files and the comments in the R code are in Portuguese, the case’s original language.
The story
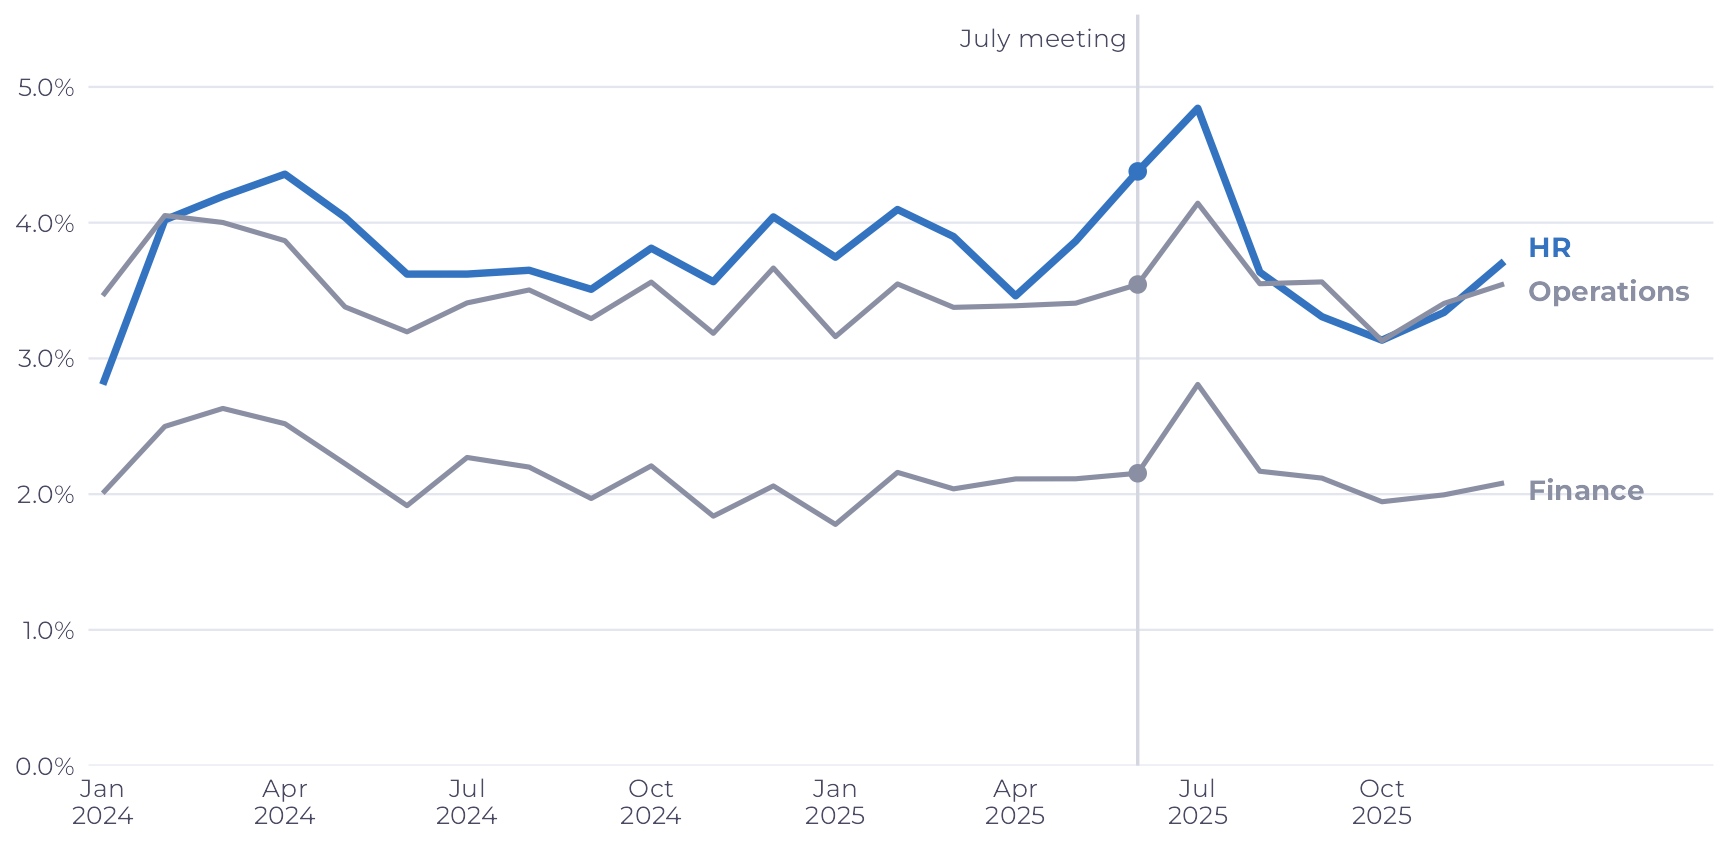
At the July 2025 results meeting, Vallora heard three absenteeism rates for June. HR showed 4.38%, Operations 3.54% and Finance 2.15%, and the meeting spent half an hour arguing about which one was right.
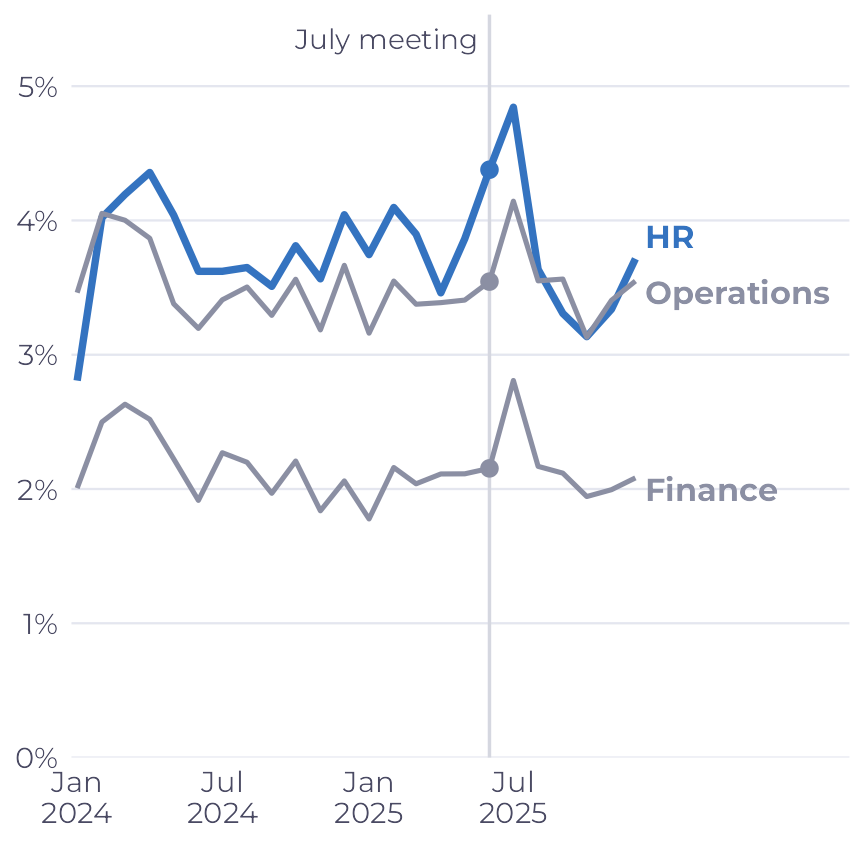
None of them was wrong. Each department calculated what it needed for its own work and gave the result the same name. The problem was not arithmetic, it was governance: nobody had written down what “absenteeism rate” meant at the company, or who got to decide.
The scene repeated itself over the following months, and in December leadership asked for an inventory of every KPI that circulated in the monthly presentations. Forty turned up, from six departments, and only 13 were well defined. The work took five weeks, in four stages:
- Interviews with the people who produce the numbers and the people who use them, in all six departments.
- Inventory and diagnosis of each KPI.
- Definition sheets for the KPIs that go to leadership.
- Governance rules: who proposes, who approves, how a change is recorded.
The divergence: three calculations, one name
The three rates come from the same data and answer different questions. The decision was to keep all three, each with its own name, and reserve “Absenteeism rate” for HR’s definition, which is the same as the Radar’s.
| HR | Operations | Finance | |
|---|---|---|---|
| Question it answers | How much of the contracted time was lost? | How many scheduled shifts went uncovered? | How much do we pay for hours not worked? |
| Numerator | Absence hours of every type, including long-term absences | Scheduled days with any absence, including late arrivals or early departures of more than 10 minutes | Absence hours paid by the company: doctor's notes, the first 15 days of sick or injury leave, and statutory leave |
| Denominator | Scheduled working hours | Scheduled days (people absent for more than 15 days come off the schedule) | Scheduled working hours |
| Unit | Hours | Days | Hours |
| 2024 value | 3.77% | 3.55% | 2.19% |
| 2025 value | 3.77% | 3.48% | 2.12% |
| Name after the project | Absenteeism rate (official, goes to leadership) | Schedule absence rate (managed by Operations) | Cost of paid hours not worked (managed by Finance) |
HR
- Question it answers
- How much of the contracted time was lost?
- Numerator
- Absence hours of every type, including long-term absences
- Denominator
- Scheduled working hours
- Unit
- Hours
- 2024 value
- 3.77%
- 2025 value
- 3.77%
- Name after the project
- Absenteeism rate (official, goes to leadership)
Operations
- Question it answers
- How many scheduled shifts went uncovered?
- Numerator
- Scheduled days with any absence, including late arrivals or early departures of more than 10 minutes
- Denominator
- Scheduled days (people absent for more than 15 days come off the schedule)
- Unit
- Days
- 2024 value
- 3.55%
- 2025 value
- 3.48%
- Name after the project
- Schedule absence rate (managed by Operations)
Finance
- Question it answers
- How much do we pay for hours not worked?
- Numerator
- Absence hours paid by the company: doctor's notes, the first 15 days of sick or injury leave, and statutory leave
- Denominator
- Scheduled working hours
- Unit
- Hours
- 2024 value
- 2.19%
- 2025 value
- 2.12%
- Name after the project
- Cost of paid hours not worked (managed by Finance)
- Operations. Operations counts the whole day even when the absence is a late arrival, which pushes the rate up, but takes anyone absent for more than 15 days off the schedule, which pulls it down. On balance, it lands a little below HR. In four of the 24 months (January and February 2024, September and November 2025), the balance flipped: in months with few long-term absences, counting the whole day weighs more, and Operations comes out above HR.
- Finance. It leaves out unexcused absences and late arrivals that are docked from pay, and whatever INSS pays from day 16 of a leave. That is why it runs well below the other two. In Brazil, the employer pays the first 15 days of sick or injury leave; from day 16 on, the social security agency (INSS) pays.
Show the R code for the three definitions
# Tipos da base: 1 atestado médico, 2 consulta ou exame (parcial), 3 acidente
# de trabalho, 4 afastamento do INSS, 5 falta injustificada, 6 atraso ou saída
# antecipada, 7 licença legal (CLT art. 473), 8 acompanhamento de dependente,
# 9 licença maternidade/paternidade (dias já fora da jornada no Radar).
# RH: horas de ausência dos tipos que contam no Radar ÷ horas previstas.
rh <- ausencias |> filter(considera_taxa == 1)

# Operação: dias escalados com qualquer ausência (atraso ou saída antecipada só
# acima de 10 minutos) ÷ dias escalados. Quem está afastado há mais de 15 dias
# (do 16º dia de um evento longo em diante) sai da escala, no numerador e no
# denominador.
afastado <- ausencias |> filter(dias_corridos > 15, dia_do_evento > 15) |> distinct(id_funcionario, data)
escala <- jornada |> anti_join(afastado, c("id_funcionario", "data"))
dias_com_ausencia <- escala |>
  semi_join(filter(ausencias, id_tipo_ausencia != 6 | horas_ausencia * 60 > 10), c("id_funcionario", "data"))

# Financeiro: horas pagas pela empresa ÷ horas previstas. Entram atestados e
# acidentes de até 15 dias, consultas, licenças legais e os 15 primeiros dias
# dos afastamentos longos por doença ou acidente (tipos 1, 3 e 4), que a empresa
# paga por lei. Ficam fora faltas e atrasos (descontados), o que o INSS paga e
# o acompanhamento de dependente.
pagas <- ausencias |>
  filter(id_tipo_ausencia == 7 |
           (id_tipo_ausencia %in% c(1, 2, 3) & dias_corridos <= 15) |
           (id_tipo_ausencia %in% c(1, 3, 4) & dias_corridos > 15 & dia_do_evento <= 15))
Diagnosis: from 40 to 14
Of the 40 KPIs, 14 go to the leadership meeting, 14 stay with the departments and 12 leave the presentations, merged or discontinued. Each KPI was given a status and a destination, using the criteria below.
| Status found | Criterion | Count |
|---|---|---|
| Well defined | Written formula, single source, an owner, and used in some decision | 13 |
| Inconsistent | Same name, different calculations across departments or sites | 7 |
| Duplicate | Different names for the same measure, or one is a slice of the other | 7 |
| Poorly designed | Volume with no reference point, a slice treated as a KPI, or the wrong incentive | 6 |
| Unused | Not part of any decision recorded in the minutes in the last six months | 4 |
| No owner | Nobody answers for the result or the calculation | 3 |
| Destination | What it means | Count |
|---|---|---|
| Leadership | Goes to the monthly meeting, with a full definition sheet, a target and an owner | 14 |
| Department level | The department tracks it with a short definition sheet; it goes to leadership only by exception | 14 |
| Merged | Becomes part of another KPI or a breakdown of it | 6 |
| Discontinued | Leaves the presentations; the data remain available | 6 |
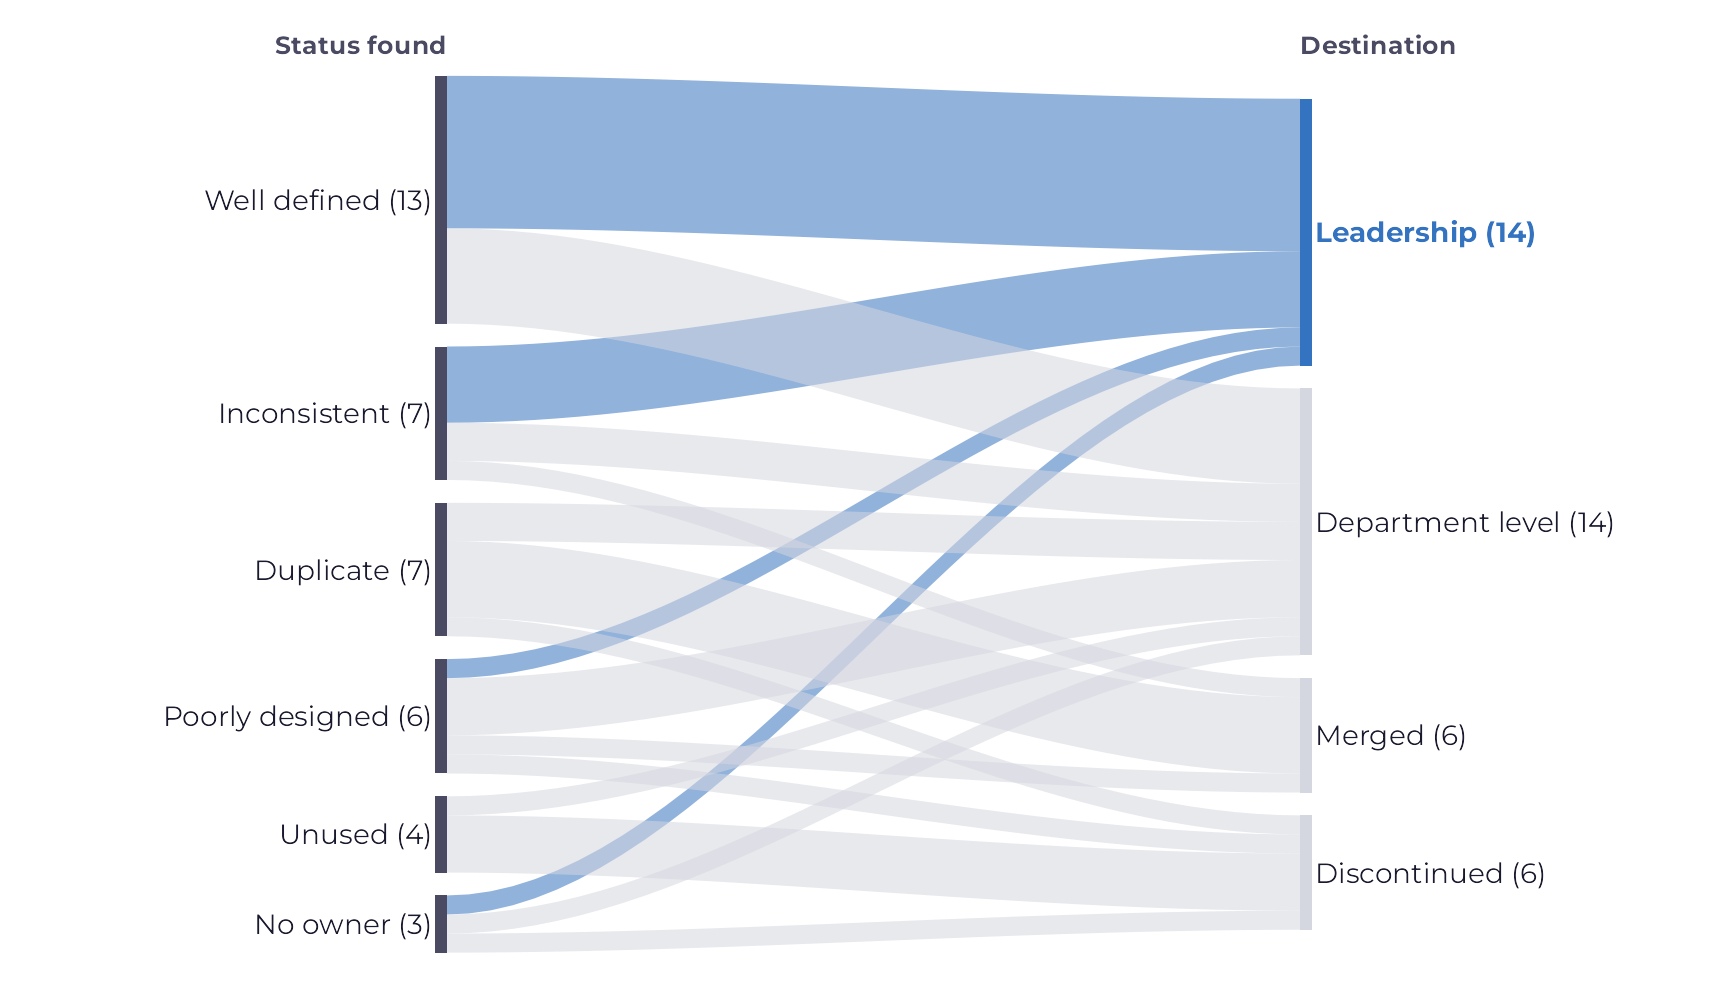
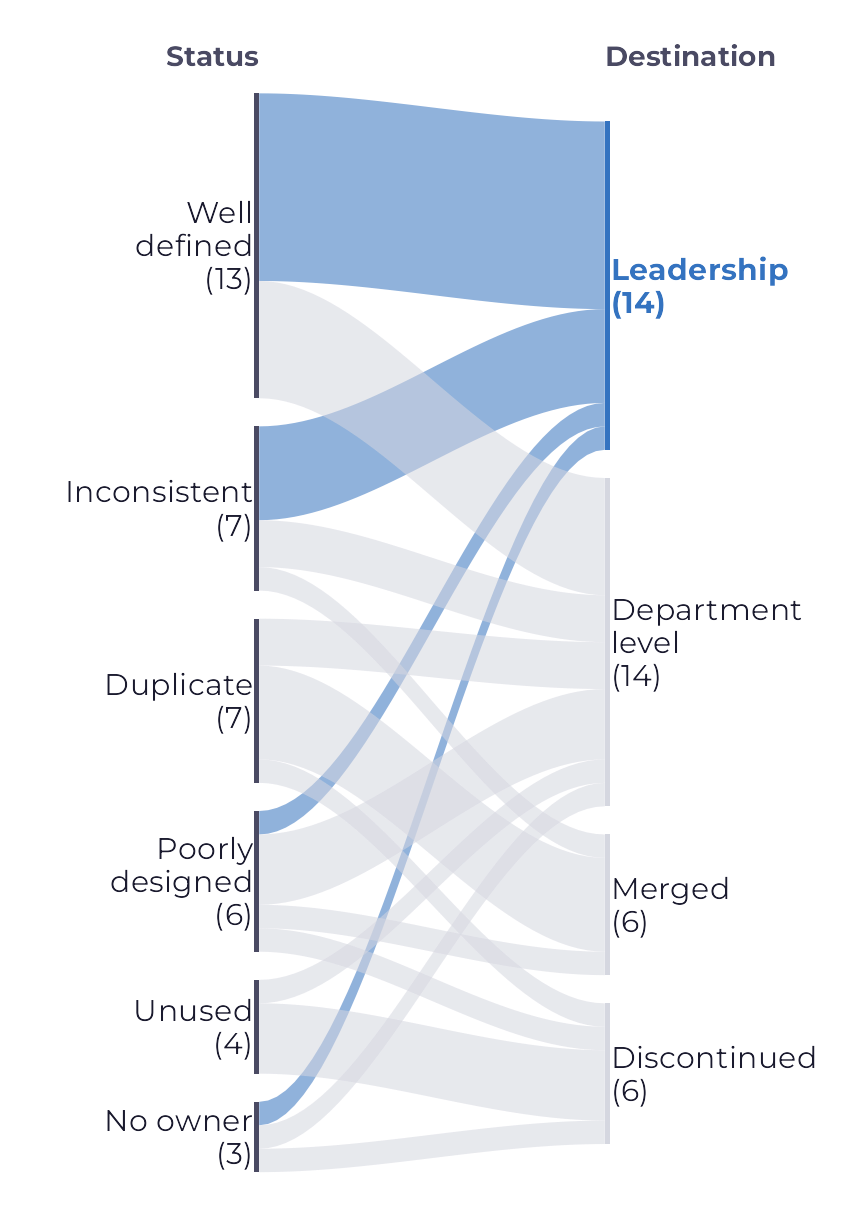
To go to leadership, a KPI has to pass three questions: it is tied to a company objective, someone in leadership makes a decision with it, and it moves enough from one month to the next to deserve the meeting.
The most instructive case is “Days without accidents”. It looks positive, but it rewards not reporting accidents; the Accident frequency rate measures the same thing without that incentive.
Inventory: the 40 KPIs
Only 13 of the 40 KPIs were well defined. The table shows the full inventory, with search and filters by department, status and destination.
40 of 40 KPIs
| # | KPI (as it was called) | Department | Status | Destination | Note | Sheet |
|---|---|---|---|---|---|---|
| 1 | EBITDA margin | Finance | Well defined | Leadership | FIN-01 | |
| 2 | Logistics cost per order | Finance | Inconsistent | Leadership | Operations left freight out of the cost | FIN-02 |
| 3 | Budget vs. actual expenses | Finance | Well defined | Leadership | FIN-03 | |
| 4 | Overdue receivables | Finance | Well defined | Leadership | FIN-04 | |
| 5 | Cost of paid hours not worked | Finance | Inconsistent | Department level | Was called absenteeism | |
| 6 | Overtime cost | Finance | Duplicate | Merged | Goes into the Overtime sheet | |
| 7 | Revenue per m² | Finance | No owner | Discontinued | ||
| 8 | Energy cost per pallet | Finance | Unused | Discontinued | ||
| 9 | OTIF by invoice | Sales | Inconsistent | Merged | Merged into OTIF by order | |
| 10 | Customer NPS | Sales | Well defined | Leadership | CLI-02 | |
| 11 | Customer complaints | Sales | Poorly designed | Leadership | A count with no base; becomes complaints per thousand orders | CLI-03 |
| 12 | Complaint response time | Sales | Well defined | Department level | ||
| 13 | Active customers | Sales | Poorly designed | Department level | Volume, no target | |
| 14 | Average ticket per customer | Sales | Unused | Discontinued | ||
| 15 | OTIF by order | Operations | Inconsistent | Leadership | Becomes the official OTIF | CLI-01 |
| 16 | Picking productivity | Operations | Well defined | Leadership | OPE-01 | |
| 17 | Inventory accuracy | Operations | Well defined | Leadership | OPE-02 | |
| 18 | Picking errors | Operations | Well defined | Leadership | OPE-03 | |
| 19 | Warehouse occupancy | Operations | Inconsistent | Leadership | Each DC measured it in positions or in m² | OPE-04 |
| 20 | Damage rate | Operations | Duplicate | Department level | Absorbs the damage figures from Quality | |
| 21 | Orders shipped per day | Operations | Poorly designed | Department level | Volume, no target | |
| 22 | Average dock time | Operations | Well defined | Department level | ||
| 23 | Schedule absences | Operations | Inconsistent | Department level | Was called absenteeism | |
| 24 | Operations overtime | Operations | Duplicate | Merged | Goes into the Overtime sheet | |
| 25 | Orders per employee | Operations | Duplicate | Discontinued | Repeats picking productivity | |
| 26 | Night team productivity | Operations | Poorly designed | Merged | A slice; becomes a shift filter | |
| 27 | Customer-reported damage | Quality | Duplicate | Merged | Goes into the damage rate | |
| 28 | Internal audits completed | Quality | Unused | Discontinued | ||
| 29 | Absenteeism rate | HR | Inconsistent | Leadership | Becomes the official definition | PES-01 |
| 30 | Absenteeism from doctor's notes | HR | Duplicate | Merged | Becomes a breakdown of the official rate | |
| 31 | Overtime percentage | HR | Duplicate | Department level | Single Overtime sheet | |
| 32 | Turnover | HR | Well defined | Department level | ||
| 33 | 90-day turnover | HR | No owner | Leadership | Calculated by hand, only now and then | PES-02 |
| 34 | Headcount | HR | Poorly designed | Department level | Volume, no target | |
| 35 | Training hours per person | HR | Well defined | Department level | ||
| 36 | Average time to hire | HR | No owner | Department level | ||
| 37 | Accident frequency rate | OHS | Well defined | Leadership | PES-03 | |
| 38 | Accident severity rate | OHS | Well defined | Department level | ||
| 39 | Days without accidents | OHS | Poorly designed | Discontinued | Rewards not reporting accidents | |
| 40 | Safety inspections completed | OHS | Unused | Department level | Gets a target and stays with OHS |
KPI tree
Fourteen KPIs, four objectives, one goal
Finance
Grow with healthy margins
- FIN-01 EBITDA margin
- FIN-02 Logistics cost per order
- FIN-03 Budget vs. actual expenses
- FIN-04 Overdue receivables
Customers
Deliver on time
- CLI-01 OTIF
- CLI-02 Customer NPS
- CLI-03 Complaints per thousand orders
Operations
Accuracy and efficiency
- OPE-01 Picking productivity
- OPE-02 Inventory accuracy
- OPE-03 Picking errors
- OPE-04 Warehouse occupancy
People
Attendance and safety
- PES-01 Absenteeism rate
- PES-02 90-day turnover
- PES-03 Accident frequency rate
Foundation: definition sheets, KPI committee and version log
Each leadership KPI answers to one of the four objectives, and the code prefix (FIN, CLI, OPE, PES) tells you which. The codes keep their Portuguese initials, as in the original project.
Definition sheets
Each of the 14 leadership KPIs got a definition sheet with the same fields. The Absenteeism rate sheet is already open, as the model; the others open with a click.
Finance: grow with healthy margins
FIN-01 EBITDA marginEBITDA ÷ net revenue × 100
- Code
- FIN-01
- Question it answers
- How much of revenue is left after operating costs and expenses?
- Linked objective
- Finance: grow with healthy margins
- Formula
- EBITDA ÷ net revenue × 100
- Numerator
- EBITDA for the month (earnings before interest, taxes, depreciation and amortization)
- Denominator
- Net service revenue for the month
- Excluded from both
- Non-recurring revenue and expenses, recorded separately and explained in the month's note
- Standard breakdowns
- Site and service line (warehousing and transportation)
- Source
- ERP (accounting)
- Frequency
- Monthly, published by the 8th business day, after the accounting close
- Polarity
- Higher is better
- Target and thresholds
- 2026 budget target; green at or above target, yellow up to 1 point below, red below that
- Owner of the result
- Finance and administration director
- Calculated by
- Financial control analyst
- Decision it supports
- Review prices and contracts with below-average margins
- Related KPIs
- Logistics cost per order, Budget vs. actual expenses
- Version
- 1.0, in effect since January 2026
FIN-02 Logistics cost per order(Warehousing + freight) ÷ orders shipped
- Code
- FIN-02
- Question it answers
- How much does it cost, on average, to store and deliver an order?
- Linked objective
- Finance: grow with healthy margins
- Formula
- (Warehousing + freight) ÷ orders shipped
- Numerator
- Warehousing cost (staff, rent, energy, equipment) plus freight paid in the month
- Denominator
- Orders shipped in the month
- Excluded from both
- Orders canceled before picking and freight reimbursed by the customer
- Standard breakdowns
- Site, customer and order size band
- Source
- ERP and WMS
- Frequency
- Monthly
- Polarity
- Lower is better
- Target and thresholds
- Up to the budgeted cost per order; green up to budget, yellow up to 5% above, red above that
- Owner of the result
- Financial controller
- Calculated by
- Financial control analyst
- Decision it supports
- Where to renegotiate freight and where to review warehouse productivity
- Related KPIs
- EBITDA margin, Picking productivity, OTIF
- Version
- 1.0, in effect since January 2026
FIN-03 Budget vs. actual expensesActual expenses ÷ budgeted expenses × 100
- Code
- FIN-03
- Question it answers
- Are expenses moving at the pace of the budget?
- Linked objective
- Finance: grow with healthy margins
- Formula
- Actual expenses ÷ budgeted expenses × 100
- Numerator
- Actual expenses for the month, on an accrual basis
- Denominator
- Budgeted expenses for the month
- Excluded from both
- Capital expenditure (capex), which is tracked separately
- Standard breakdowns
- Department, cost center and type of expense
- Source
- ERP
- Frequency
- Monthly
- Polarity
- Close to 100%
- Target and thresholds
- Between 97% and 103%; yellow up to 5 points outside the range, red beyond that
- Owner of the result
- Financial controller
- Calculated by
- Financial control analyst
- Decision it supports
- Which departments need to explain the variance and revise the full-year forecast
- Related KPIs
- EBITDA margin
- Version
- 1.0, in effect since January 2026
FIN-04 Overdue receivablesMore than 30 days overdue ÷ total receivables × 100
- Code
- FIN-04
- Question it answers
- How much of what we are owed is more than 30 days overdue?
- Linked objective
- Finance: grow with healthy margins
- Formula
- More than 30 days overdue ÷ total receivables × 100
- Numerator
- Invoices more than 30 days overdue on the last day of the month
- Denominator
- Total receivables on the last day of the month
- Excluded from both
- Invoices in litigation, tracked separately
- Standard breakdowns
- Customer and days-overdue band (31 to 60, 61 to 90, more than 90)
- Source
- ERP (accounts receivable)
- Frequency
- Monthly
- Polarity
- Lower is better
- Target and thresholds
- Up to 2%; yellow up to 3%, red above
- Owner of the result
- Financial controller
- Calculated by
- Financial analyst
- Decision it supports
- When to put a customer on hold and renegotiate terms
- Related KPIs
- EBITDA margin
- Version
- 1.0, in effect since January 2026
Customers: deliver on time
CLI-01 OTIFOrders delivered on time and in full ÷ orders shipped × 100
- Code
- CLI-01
- Question it answers
- How many orders reached the customer on time and in full?
- Linked objective
- Customers: deliver on time
- Formula
- Orders delivered on time and in full ÷ orders shipped × 100
- Numerator
- Orders delivered by the agreed date with no missing items
- Denominator
- Orders shipped in the month
- Excluded from both
- Orders canceled by the customer (since version 1.1)
- Standard breakdowns
- Site, customer, carrier and reason for the miss (timing or completeness)
- Source
- WMS and TMS
- Frequency
- Monthly
- Polarity
- Higher is better
- Target and thresholds
- 95%; green from 95%, yellow from 92%, red below
- Owner of the result
- Operations manager
- Calculated by
- BI analyst
- Decision it supports
- Which customers and carriers need an action plan
- Related KPIs
- Complaints per thousand orders, Picking errors
- Version
- 1.1, in effect since February 2026
CLI-02 Customer NPS% promoters minus % detractors
- Code
- CLI-02
- Question it answers
- Would customers recommend Vallora?
- Linked objective
- Customers: deliver on time
- Formula
- % promoters minus % detractors
- Numerator
- Promoters (scores of 9 and 10) minus detractors (scores of 0 to 6), in percentage points
- Denominator
- Valid responses to the quarter's survey
- Excluded from both
- Responses without a score and customers with less than three months under contract
- Standard breakdowns
- Customer segment and the site that serves it
- Source
- Customer survey
- Frequency
- Quarterly
- Polarity
- Higher is better
- Target and thresholds
- 50 points; yellow from 40, red below
- Owner of the result
- Sales manager
- Calculated by
- Sales analyst
- Decision it supports
- Which accounts get a visit and an improvement plan
- Related KPIs
- OTIF, Complaints per thousand orders
- Version
- 1.0, in effect since January 2026
CLI-03 Complaints per thousand ordersValid complaints ÷ orders shipped × 1,000
- Code
- CLI-03
- Question it answers
- How often does an order lead to a valid complaint?
- Linked objective
- Customers: deliver on time
- Formula
- Valid complaints ÷ orders shipped × 1,000
- Numerator
- Complaints logged in the CRM and judged valid in the month
- Denominator
- Orders shipped in the month
- Excluded from both
- Complaints judged invalid and requests for information
- Standard breakdowns
- Reason for the complaint, customer and site
- Source
- CRM and WMS
- Frequency
- Monthly
- Polarity
- Lower is better
- Target and thresholds
- Up to 3 per thousand orders; yellow up to 5, red above
- Owner of the result
- Sales manager
- Calculated by
- BI analyst
- Decision it supports
- Which reasons to tackle first, together with Operations
- Related KPIs
- OTIF, Picking errors, Customer NPS
- Version
- 1.0, in effect since January 2026
Operations: accuracy and efficiency
OPE-01 Picking productivityLines picked ÷ hours worked in picking
- Code
- OPE-01
- Question it answers
- How many order lines does picking deliver per hour worked?
- Linked objective
- Operations: accuracy and efficiency
- Formula
- Lines picked ÷ hours worked in picking
- Numerator
- Order lines picked and checked in the month
- Denominator
- Hours actually worked by the picking team, including overtime
- Excluded from both
- Training hours and inventory-count hours
- Standard breakdowns
- Site, shift and order type (each picks or full cases)
- Source
- WMS and time-and-attendance
- Frequency
- Monthly
- Polarity
- Higher is better
- Target and thresholds
- Each site's standard, reviewed once a year; yellow up to 10% below, red below that
- Owner of the result
- Operations manager
- Calculated by
- BI analyst
- Decision it supports
- Size the schedule and prioritize layout improvements
- Related KPIs
- Picking errors, Logistics cost per order, Absenteeism rate
- Version
- 1.0, in effect since January 2026
OPE-02 Inventory accuracyPositions with no discrepancy ÷ positions counted × 100
- Code
- OPE-02
- Question it answers
- Does the stock in the system match what is on the shelf?
- Linked objective
- Operations: accuracy and efficiency
- Formula
- Positions with no discrepancy ÷ positions counted × 100
- Numerator
- Positions counted in cycle counting with no item or quantity discrepancy
- Denominator
- Positions counted in the month
- Excluded from both
- Positions blocked for receiving or shipping on the day of the count
- Standard breakdowns
- Site, warehouse zone and ABC class
- Source
- WMS (cycle counting)
- Frequency
- Monthly
- Polarity
- Higher is better
- Target and thresholds
- 99.5%; yellow from 99%, red below
- Owner of the result
- Operations manager
- Calculated by
- Inventory analyst
- Decision it supports
- Where to recount and where to review the slotting process
- Related KPIs
- Picking errors, OTIF
- Version
- 1.0, in effect since January 2026
OPE-03 Picking errorsLines with errors ÷ lines picked, in parts per million
- Code
- OPE-03
- Question it answers
- How many lines go out with the wrong item or quantity?
- Linked objective
- Operations: accuracy and efficiency
- Formula
- Lines with errors ÷ lines picked, in parts per million
- Numerator
- Lines with errors caught at checking or reported by the customer
- Denominator
- Lines picked in the month
- Excluded from both
- Discrepancies caused by the customer's product data
- Standard breakdowns
- Site, shift and where the error was caught (checking or customer)
- Source
- WMS and complaints
- Frequency
- Monthly
- Polarity
- Lower is better
- Target and thresholds
- Up to 500 parts per million; yellow up to 800, red above
- Owner of the result
- Operations manager
- Calculated by
- BI analyst
- Decision it supports
- Where to reinforce training and checking
- Related KPIs
- Picking productivity, Complaints per thousand orders
- Version
- 1.0, in effect since January 2026
OPE-04 Warehouse occupancyPallet positions occupied ÷ pallet positions available × 100
- Code
- OPE-04
- Question it answers
- How much of the storage capacity is in use?
- Linked objective
- Operations: accuracy and efficiency
- Formula
- Pallet positions occupied ÷ pallet positions available × 100
- Numerator
- Pallet positions occupied on the last day of the month
- Denominator
- Pallet positions available, excluding those blocked for maintenance
- Excluded from both
- Floor-stacking areas, measured in m² and tracked separately
- Standard breakdowns
- Site and position type (pallet racking or picking)
- Source
- WMS
- Frequency
- Monthly
- Polarity
- Within a range
- Target and thresholds
- Between 80% and 88%; yellow between 75% and 80% or between 88% and 92%, red outside that
- Owner of the result
- Operations manager
- Calculated by
- BI analyst
- Decision it supports
- When to look for extra space or take on a new customer
- Related KPIs
- Picking productivity, Logistics cost per order
- Version
- 1.0, in effect since January 2026
People: attendance and safety
PES-01 Absenteeism rateAbsence hours ÷ scheduled hours × 100
- Code
- PES-01
- Question it answers
- How much of the contracted time did the company lose to absences?
- Linked objective
- People: attendance and safety
- Formula
- Absence hours ÷ scheduled hours × 100
- Numerator
- Absence hours of every type: unexcused absences, doctor's notes, long-term absences, late arrivals and early departures, based on the day's scheduled hours
- Denominator
- Scheduled hours of everyone who was active that day
- Excluded from both
- Vacation, days off, holidays, days before hiring and after termination
- Standard breakdowns
- Short-term (up to 15 days) and long-term; absence type; site, shift, department and tenure (up to 90 days)
- Source
- Time-and-attendance system (schedules and clock-ins) and payroll (long-term absences)
- Frequency
- Monthly, published by the 5th business day
- Polarity
- Lower is better
- Target and thresholds
- 3.5% target for 2026; green up to 3.5%, yellow up to 4.0%, red above
- Owner of the result
- HR manager; each DC manager answers for their site
- Calculated by
- BI analyst
- Decision it supports
- Where to investigate first and when to open an action plan for a team
- Related KPIs
- Schedule absence rate, Cost of paid hours not worked, Overtime
- Version
- 1.1, in effect since March 2026 (see the version log)
PES-02 90-day turnoverNew hires who left before 90 days ÷ new hires in the month × 100
- Code
- PES-02
- Question it answers
- How many new hires leave before completing 90 days?
- Linked objective
- People: attendance and safety
- Formula
- New hires who left before 90 days ÷ new hires in the month × 100
- Numerator
- People hired in the reference month who left before completing 90 days
- Denominator
- People hired in the reference month
- Excluded from both
- Temporary contracts and apprentices, tracked separately
- Standard breakdowns
- Site, role, shift and reason for leaving (resignation or dismissal)
- Source
- Payroll
- Frequency
- Monthly, with a 3-month lag
- Polarity
- Lower is better
- Target and thresholds
- Up to 15%; yellow up to 20%, red above
- Owner of the result
- HR manager
- Calculated by
- HR analyst
- Decision it supports
- Review recruiting and onboarding at the sites and roles most affected
- Related KPIs
- Absenteeism rate, Accident frequency rate
- Version
- 1.0, in effect since January 2026
PES-03 Accident frequency rateLost-time accidents × 1,000,000 ÷ hours worked
- Code
- PES-03
- Question it answers
- How often does someone get hurt and need time off?
- Linked objective
- People: attendance and safety
- Formula
- Lost-time accidents × 1,000,000 ÷ hours worked
- Numerator
- Work accidents with at least one day of absence, reported on the official accident form (CAT)
- Denominator
- Hours actually worked in the month, including overtime
- Excluded from both
- Commuting accidents, tracked separately
- Standard breakdowns
- Site, shift, department and tenure
- Source
- OHS and time-and-attendance
- Frequency
- Monthly
- Polarity
- Lower is better
- Target and thresholds
- 20% reduction from the 2025 average; yellow up to the 2025 average, red above
- Owner of the result
- OHS coordinator
- Calculated by
- Safety technician
- Decision it supports
- Where to focus safety inspections and training
- Related KPIs
- Absenteeism rate, 90-day turnover
- Version
- 1.0, in effect since January 2026
Two details that show the method: Warehouse occupancy has no “higher is better”, because a warehouse that is too full jams the operation; and 90-day turnover only closes three months after hiring, so the sheet says so, and nobody asks for the number before it exists.
Governance: who decides what each number means
No definition changes without a request, a test and an approval on record. The decision belongs to a KPI committee: the financial controller chairs it, the owners of the 14 KPIs take part, and the BI analyst keeps the minutes. It meets once a month, for 30 minutes, only when there are requests in the queue.
Roles (RACI matrix)
R does the work, A approves and answers for it, C is consulted, I is informed.
| Activity | KPI owner | BI analyst | Committee | Leadership |
|---|---|---|---|---|
| Propose a new KPI or a change of definition | R | C | A | I |
| Measure the impact of the change | C | R | A | |
| Approve or reject the change | C | C | R and A | I |
| Update the definition sheet and the version log | I | R | A | |
| Calculate and publish every month | C | R and A | I | |
| Explain the result and the action plan | R and A | C | I | |
| Review the whole set once a year | C | R | A | C |
| Discontinue a KPI | C | R | A | I |
Propose a new KPI or a change of definition
Owner R · BI C · Committee A · Leadership I
Measure the impact of the change
Owner C · BI R · Committee A
Approve or reject the change
Owner C · BI C · Committee R and A · Leadership I
Update the definition sheet and the version log
Owner I · BI R · Committee A
Calculate and publish every month
Owner C · BI R and A · Leadership I
Explain the result and the action plan
Owner R and A · BI C · Leadership I
Review the whole set once a year
Owner C · BI R · Committee A · Leadership C
Discontinue a KPI
Owner C · BI R · Committee A · Leadership I
How a definition changes
- The owner opens a request: what changes, why, and from when.
- BI recalculates the last 12 months under the new rule and shows the difference.
- The committee approves, rejects or asks for changes at its next meeting.
- Once approved, BI updates the definition sheet, bumps the version and logs the change.
- The history is recalculated; when that is not possible, the break is marked on the chart.
Version log (example)
| Date | KPI | Version | Change | Reason |
|---|---|---|---|---|
| March 2026 | PES-01 Absenteeism rate | 1.1 | New breakdown by tenure (up to 90 days) | The Radar showed that new hires are absent more often |
| February 2026 | CLI-01 OTIF | 1.1 | Orders canceled by the customer leave the denominator | They counted as an Operations failure |
| January 2026 | All 14 leadership KPIs | 1.0 | First version of the definition sheets | Governance project |
March 2026 · version 1.1
PES-01 Absenteeism rate
New breakdown by tenure (up to 90 days)
Reason: The Radar showed that new hires are absent more often
February 2026 · version 1.1
CLI-01 OTIF
Orders canceled by the customer leave the denominator
Reason: They counted as an Operations failure
January 2026 · version 1.0
All 14 leadership KPIs
First version of the definition sheets
Reason: Governance project
Results
The monthly meeting traded six presentations and 40 numbers for a single page with 14 KPIs, each with its owner in the room to explain it. When Operations talks about its rate, it now goes by another name, and the July argument does not happen again. The Absenteeism Radar now uses the official PES-01 definition.
What this case demonstrates
- Separating the math from the governance. A divergence is rarely a calculation error; it is almost always the lack of a written definition and of someone who decides.
- Cutting without deleting. Twenty-six KPIs left the leadership meeting, and no department lost information it needs.
- Definition sheets that answer the questions that start arguments: what goes in, what stays out, whether higher is better, when the number closes.
- Changes on record, so that today’s number stays comparable with last year’s.
- A bridge to BI. The definition sheets become the DAX measures and the dashboard’s data dictionary, and the dashboard stops hiding rules.
Does your company argue about which number is right before discussing what to do about it?
Tell me how your KPIs are calculated today and I will tell you where to start.